Drill down
Client mode / Dashboard
When you detect unusual spikes of traffic or high end-to-end latency for a specific application, you might need more details to understand the issue. The drill down feature will help you deep-dive, step-by-step by displaying the relevant dashboards. When you need more details on a site, DSCP, device or application, click on the magnifying glass beside the legend. LiveSP will automatically propose the relevant dashboards.
Access more details by clicking
 on a dashlet legend.
on a dashlet legend.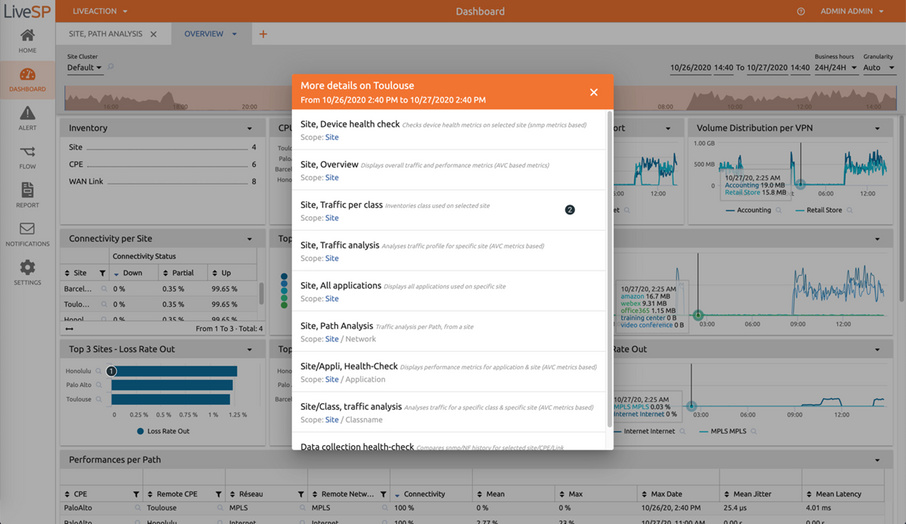
1. Click on the loop next to selected element you want to drill down on (site, device, application, etc.).
2. Choose the new dashboard to open to display more details.